
Email Marketing Statistics 2026: Benchmarks, ROI, and Trends


Almost every email marketing page quotes the same number: $36 back for every $1 spent. That figure comes from a 2020 Litmus survey. It gets reused every year with no update.
Litmus’s own 2026 research tells a more useful story. ROI now ranges from $36 to $42, and it varies sharply by segment, industry, and how well a team actually measures it.
This page uses that fuller picture. Every stat below includes its source, date, and scope, so you can see exactly what it measures and how current it is.
Key Email Marketing Statistics at a Glance
- Email marketing ROI averages $36 to $42 per $1 spent in 2026, with real variation by segment (Source: Litmus, State of Email 2026)
- Only 15% of marketers still treat open rate as their primary success metric, since Apple Mail Privacy Protection inflates recorded opens by 15 to 20 percentage points (Source: Klaviyo, 2026 Omnichannel Benchmark Report)
- 59% of marketers name email their most effective revenue channel, ahead of social media at 14% and paid search at 12% (Source: HubSpot State of Marketing 2026, cited via Searchlab’s compiled 2026 benchmark roundup, original HubSpot report page not independently accessed)
- Automated email flows generate roughly 41% of total email revenue from just 5.3% of total sends (Source: Klaviyo, 2026 Omnichannel Benchmark Report)
- Advanced AI adopters are 75% more likely to hit ROI above 45:1 than teams that don’t use AI in their email program (Source: Litmus, State of Email 2026)
- 68% of B2B marketers name email their primary lead generation channel, ahead of LinkedIn at 52% and Google Ads at 41% (Source: HubSpot B2B Marketing Report 2026, cited via Searchlab’s compiled 2026 benchmark roundup, original HubSpot report page not independently accessed)
- Global inbox placement runs around 87%, with meaningful gaps by region and by how well senders meet Gmail and Yahoo’s 2024 authentication rules (Source: DMA Email Benchmarking Report 2026, sponsored by Validity, cited via Open-Rate.com’s benchmark compilation, original DMA report not independently accessed)
Global Email Usage Statistics
Email User Growth
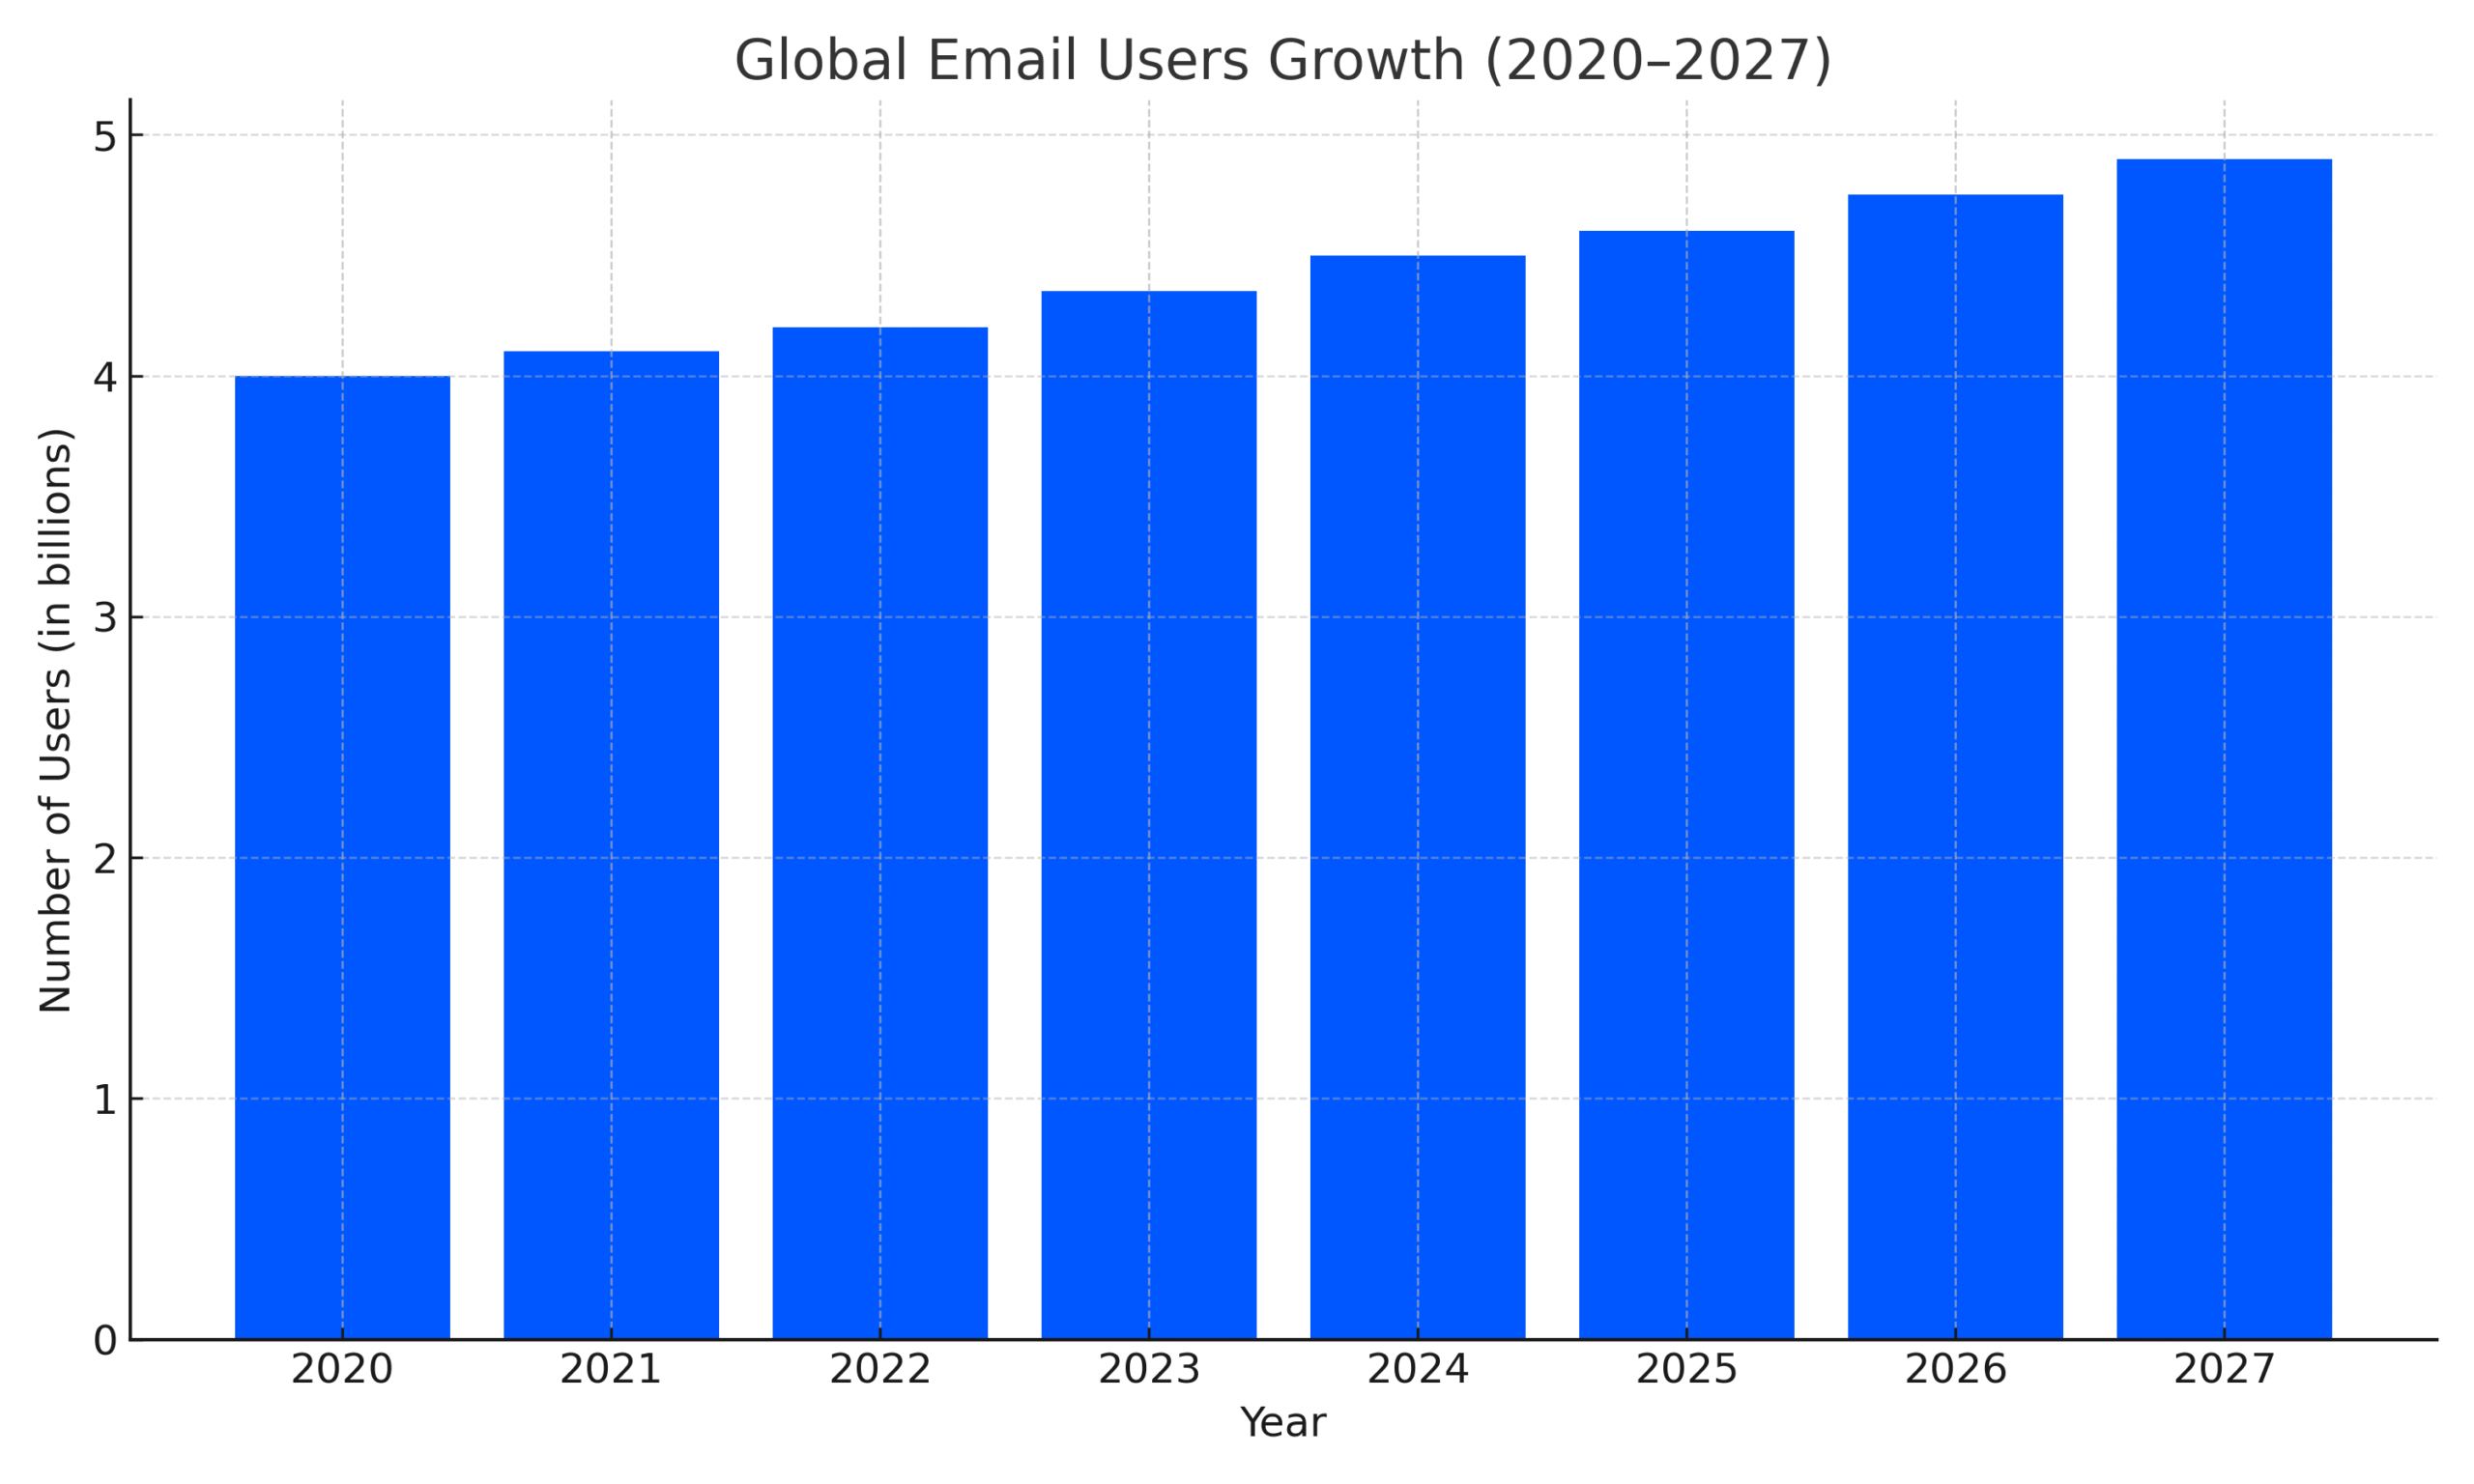
The chart below shows that the number of email users grew from 4 billion in 2020 to 4.73 billion in 2026, and is expected to reach 4.85 billion by 2027. This steady growth shows how email continues to reach more people.
392.5 billion emails are expected to be sent every single day in 2026. That’s up from 376 billion in 2025.
97% of internet users in developed markets have an email address and check it an average of three times daily. That reach still outpaces any single social platform.
Volume is the real challenge for marketers now. With inboxes this crowded, small performance gaps translate directly into lost leads and lost revenue.
Email Client Market Share (2026)
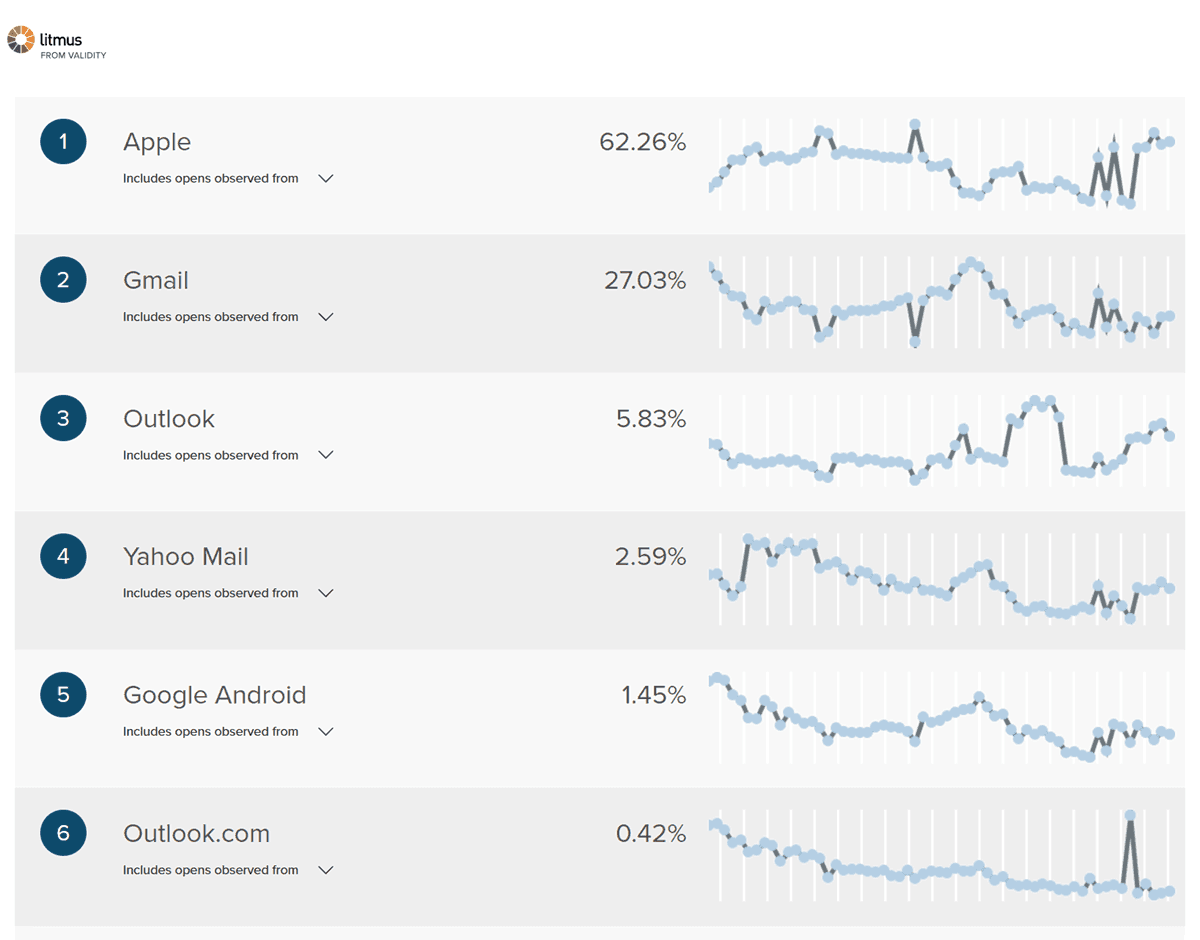
1. Apple and Gmail lead the market: Apple Mail (with Mail Privacy Protection) and Gmail together make up almost 90% of the market share. Focusing on these two platforms is essential for email deliverability and how emails appear.
2. Impact of Mail Privacy Protection (MPP): Studies show that Apple’s MPP now affects about 55-60% of all email opens. Marketers are moving from tracking open rates to using more reliable metrics like CTR and conversion data.
3. Rise of Mobile and Dark Mode: Most subscribers now read emails on mobile devices. Dark Mode is also important for design, with more than 25% of users choosing this setting.
Email Marketing ROI Statistics
ROI by Industry Segment
The flat “$36 per $1” number hides real variation once you break it down by segment. Litmus’s 2026 data, cross-referenced with Validity’s benchmarking, shows a meaningful spread.
| Segment | Average ROI per $1 |
| Nonprofit and fundraising | $44 |
| Retail and ecommerce | $42 |
| B2B professional services | $32 |
| SaaS | Lower than average; exact figure varies by report |
(Source: Litmus, State of Email 2026; segment breakdown via Validity benchmarking data, cited through Open-Rate.com)
Time investment tracks with return. Litmus found teams hitting 36:1 to 50:1 ROI dedicate 25% to 50% of total marketing time to email specifically, not a side channel run on autopilot.
Only 12.5% of companies believe they’re measuring their own email ROI accurately. That means most brands likely underreport their best-performing channel, not overstate it.
Why Open Rate Alone Is No Longer Reliable
Apple Mail Privacy Protection automatically preloads images for Apple Mail users. That single feature inflates recorded open rates by 15 to 20 percentage points across most datasets.
Zeta Global’s analysis puts this in stark terms: unique opens averaged 40%, but the true open rate, once mailbox-provider inflation is stripped out, was closer to 11% (Source: DMA Email Benchmarking Report 2026, via Open-Rate.com).
As a result, only 15% of marketers still treat open rate as a primary metric. Revenue per email, click-to-open rate, and list health are replacing it as the numbers that actually matter.
Email Marketing Benchmarks by Industry
Open Rate, CTR, and CTOR Explained
Three metrics get confused constantly, and they measure entirely different things.
Open rate is the share of recipients who opened your email, now unreliable on its own due to Apple MPP. Click rate (CTR) is the share of all recipients who clicked something inside the email. Click-to-open rate (CTOR) is the share of people who opened the email who then clicked, a cleaner read on whether your actual content is engaging.
| Metric | 2026 Global Average | Top 10% Performers |
| Open rate (raw, MPP-inflated) | 20.73% to 44% depending on measurement | Up to 44.02% |
| Click rate (CTR) | 1.69% to 2.82% | Up to 5.22% |
| Click-to-open rate (CTOR) | 6.81% (up from 5.63% in 2024) | 14.82% (manufacturing) |
(Source: Brevo, 2026 Marketing Orchestration Benchmark; MailerLite, 2026 Benchmark Report; Klaviyo, 2026 Omnichannel Benchmark Report)
A low open rate paired with a high CTOR is actually a good sign. It means the people who do open your emails find the content worth clicking, so fixing subject lines and deliverability would likely lift overall results further.
What Counts as a Good Open Rate and CTOR
By industry, CTOR shows the widest and most useful spread of any metric tracked.
| Industry | CTOR |
| Manufacturing | 14.82% |
| Legal | 14.72% |
| Media | 12.92% |
| Insurance | 3.19% |
| Politics | 2.96% |
(Source: MailerLite, 2026 Email Marketing Benchmarks report)
A “good” open rate depends entirely on how you’re measuring it. Treat anything above roughly a 25% raw open rate, or a CTOR above the 6.81% global median, as solid performance rather than chasing an inflated headline number.
Automation and Flow Performance
Automated flows are quietly doing most of the revenue work in modern email programs, even though they’re a small share of total send volume.
| Metric | Campaigns (One-Off Sends) | Automated Flows |
| Share of total sends | 94.7% | 5.3% |
| Share of total email revenue | ~59% | ~41% |
| Relative click rate | Baseline | ~3x higher |
| Relative placed-order rate | Baseline | ~13x higher |
(Source: Klaviyo, 2026 Omnichannel Benchmark Report, based on 183,000+ brands)
Welcome series and abandoned cart flows carry most of this advantage. They reach someone at the exact moment they’ve shown intent, rather than competing for attention in a general newsletter send.
The practical read: if your program is 100% one-off campaigns and zero automated flows, you’re leaving a disproportionate share of available revenue unclaimed relative to the effort it takes to set a flow up once.
Mobile Email Marketing Statistics
Mobile has been the leading email-open environment since 2015. That hasn’t changed, though device-level tracking is now distorted by the same privacy features affecting open rate broadly.
Emails not built for mobile still get deleted fast by recipients who can’t read them properly. Responsive design remains a baseline requirement, not an optimization.
Personalization and AI in Email Marketing
AI adoption in email marketing has moved from experimental to standard practice. Litmus found advanced AI adopters are 75% more likely to hit ROI above 45:1 than teams that aren’t using it.
AI-generated and AI-optimized subject lines outperform manually written ones by roughly 26% on open rate, according to compiled 2026 industry data.
AI adoption also correlates with better technical hygiene, not just better copy. Litmus found advanced AI adopters are 54% more likely to follow WCAG accessibility standards and 52% more likely to comply with the European Accessibility Act, suggesting AI-forward teams tend to be more process-mature overall, not just better at writing subject lines.
Segmentation still matters more than most personalization tactics individually. Segmented campaigns deliver 14% to 30% higher open rates than non-segmented sends, a gap that’s held steady for several years running.
Interactive email formats, especially AMP for Email, are a smaller but growing part of the personalization picture. Adoption is growing roughly 34% year over year, and interactive elements like in-email forms and product browsing increase engagement by approximately 73% where implemented, though this remains a minority tactic rather than a baseline expectation in 2026.
Email Marketing Statistics by Country
Regional performance varies enough that a single global benchmark can mislead you if your audience sits in one specific market.
| Country/Region | Open Rate | CTOR | Notable Detail |
| United States | ~45.6% | ~9.5% | High volume, lower relative engagement per open |
| United Kingdom | N/A (see delivery data) | N/A | 99.2% delivered rate; inbox placement ~91%, down 2+ points YoY |
| India | ~25.8% | ~31.8% | Lower open rate but the highest CTOR of any major market |
| Australia | Highest of any region tracked | 8.3% (highest globally) | Also leads on raw click rate at 2.82% |
(Source: GetResponse-sourced country benchmarks, compiled via Mailotrix, 2024-2025 data; MailerLite, 2026 regional benchmarks; DMA Email Benchmarking Report 2026 for UK figures, via Open-Rate.com)
India’s numbers are worth a moment of thought. Open rate looks weak next to the US, but CTOR more than triples the US figure. Fewer people open, but the ones who do are far more likely to act.
The UK’s delivery data comes from a more current, more directly sourced report than the open-rate figures above. Inbox placement has actually declined slightly as Microsoft and other mailbox providers tighten enforcement on bulk senders, and B2B-specific delivery rates improved from 90.7% to 95.6% over the same period.
B2B Email Marketing Benchmarks
Email remains B2B’s dominant lead generation channel, and the gap over alternatives is wide.
| Channel | Share of B2B Marketers Naming It Primary |
| 68% | |
| 52% | |
| Google Ads | 41% |
(Source: HubSpot B2B Marketing Report 2026, cited via Searchlab’s compiled 2026 benchmark roundup, original HubSpot report page not independently accessed)
Government and public administration sectors post the highest B2B-adjacent click-through rates, largely due to perceived relevance and audience trust. Nonprofits and NGOs post the lowest unsubscribe rates of any sector tracked, since their subscribers largely opt in out of genuine interest rather than transactional necessity.
Email Deliverability and Spam Statistics
Since February 2024, Gmail and Yahoo require any sender pushing roughly 5,000+ daily messages to personal accounts to authenticate with SPF, DKIM, and DMARC, support one-click unsubscribe, and keep spam complaints under 0.3%.
Global inbox placement averages around 87%. That means roughly 13% of legitimately sent marketing email never reaches the inbox, regardless of open rate.
List decay runs at approximately 22.5% per year. That’s not a spam problem; it’s a natural churn rate that makes regular list cleaning a requirement, not an optional best practice.
Frequently Asked Questions
Q: What’s a good open rate for email marketing?
A: Treat 20-25% as solid on a raw, Apple MPP-inflated basis. Since that figure runs artificially high for a meaningful share of Apple Mail users, click-to-open rate above the 6.81% global median is a more reliable signal of real engagement.
Q: What’s a good CTOR for email marketing?
A: The 2026 global median is 6.81%, up from 5.63% in 2024. Anything above 10% puts you ahead of most industries tracked, and top performers in manufacturing and legal exceed 14%.
Q: What’s the average email marketing ROI in 2026?
A: $36 to $42 per $1 spent overall, though it varies by segment: nonprofits average $44, retail and ecommerce average $42, and B2B professional services average $32.
Q: How do B2B and B2C email benchmarks differ?
A: B2B marketers rank email as their top lead generation channel at 68%, ahead of LinkedIn and Google Ads. B2C benchmarks skew more toward automated flow revenue, since flows generate 41% of total email revenue from just 5.3% of sends, largely in ecommerce contexts.
Conclusion
The honest state of email marketing in 2026 is that the metrics everyone’s used for years, open rate especially, have quietly become less trustworthy even as the channel itself keeps outperforming nearly everything else marketers spend on.
The teams pulling ahead aren’t chasing a bigger open rate number. They’re measuring CTOR, revenue per send, and segment-level ROI, and putting real time into the channel rather than running it on autopilot.
This page will be updated as Litmus, HubSpot, Klaviyo, and the DMA publish new benchmark data through the rest of 2026.
Also read: 100+ Social Media Statistics 2026: Demographics & Trends
