
AI Search Statistics 2026: The Complete Data Report

Google’s own Q2 2026 earnings call confirmed something most SEOs had already felt in their traffic graphs: AI Mode alone has surpassed 1 billion monthly active users since expanding globally in October 2025. Gemini has grown from 650 million users in October 2025 to 950 million by July 2026. And ChatGPT’s weekly active users doubled from 400 million to 900 million over roughly the same stretch.
At the same time, Google’s Search and other revenue grew 17% to $63.3 billion in that same quarter. Search isn’t shrinking. It’s splitting into new surfaces, and half a dozen tracking firms still argue over the data on how people move between them, each measuring something slightly different.
This report pulls every AI search statistic worth knowing for 2026 into one place, with the source, sample size, and date attached to each one. Where a number gets repeated everywhere but doesn’t trace back to a real study, we say so instead of passing it along.
AI Search Statistics at a Glance
- Google’s Gemini app: 950 million monthly active users as of Q2 2026 (Alphabet Q2 2026 earnings release, SEC filing)
- Google AI Mode: surpassed 1 billion monthly active users since its October 2025 global expansion (Alphabet Q2 2026 earnings call transcript)
- ChatGPT: 900 million weekly active users as of February 2026, per OpenAI via Reuters
- Google AI Overview trigger rate: reported anywhere from roughly 25% to over 60% of queries depending on tracker and month, a spread this report explains in detail below
- 49% of US adults now use AI chatbots, up from 33% in 2024 (Pew Research Center, “Americans and AI 2026,” June 17, 2026)
- 60% of US adults say they read AI-generated summaries at the top of search results (Pew Research Center, June 2026)
- Organic click-through rate on AI Overview queries fell from 1.76% to a low of roughly 0.61% to 1.3%, then rebounded to about 2.4% by February 2026 (Seer Interactive, reported via multiple 2026 analyses of its research)
- ChatGPT’s share of AI-search activity fell from 78% to 56% between July 2025 and July 2026, while Gemini rose from 15% to 30% and Claude from 2% to 10% (Growth Memo, May 2026)
AI Search Adoption: How Many People Use AI to Search
How Many People Use AI Search in 2026
Pew Research Center’s most recent nationally representative survey, fielded February 17 to 23, 2026, among 5,119 US adults, found 49% of Americans now say they use AI chatbots like ChatGPT, Gemini, or Copilot. That’s up from 33% in 2024, per the same tracking question.
Chatbot use and AI search use aren’t identical, but they overlap heavily. In that same survey, 54% of adults 18 to 49 said they use chatbots specifically to search for information, a use case Pew tracked directly rather than inferring (Source: Pew Research Center, June 2026).
How Fast Is AI Search Adoption Growing?
The growth curve is steep and well documented at the platform level. ChatGPT’s weekly active user base doubled from 400 million to 900 million between February 2025 and February 2026, per OpenAI’s own disclosure reported by Reuters. Gemini’s monthly active users climbed from roughly 650 million in October 2025 to 950 million by Q2 2026, a nearly 50% increase in nine months (Alphabet Q2 2026 earnings materials).
At the population level, Pew’s chatbot-use tracking shows the same acceleration: 23% of US adults in 2023, 33% in 2024, 49% in early 2026.
AI Search Adoption by Country
Reliable, methodologically comparable adoption data outside the US is still thin. What we can confirm: OpenAI has reported that ChatGPT adoption in lower-income countries runs more than four times higher, proportionally, than in high-income countries, based on its own usage analysis (Source: OpenAI’s “How ChatGPT adoption has expanded,” June 30, 2026).
India crossed 100 million weekly ChatGPT users as of OpenAI’s February 2026 disclosure. (Source: OpenAI’s “Introducing OpenAI for India”)
Beyond those two data points, most “AI search by country” tables circulating online blend estimates from several unrelated studies without a shared methodology, so we’re not presenting a full country ranking here.
AI Search Adoption by Age Group
This is genuinely well documented, straight from Pew’s underlying survey data:
| Age group | Ever use AI chatbots (2026) | Ever use AI chatbots (2024) | Use chatbots daily |
| All US adults | 49% | 33% | 24% |
| 18 to 29 | 66% | 55% | 31% |
| 30 to 49 | 61% | 41% | 34% |
| 50 to 64 | 42% | 25% | 19% |
| 65+ | 23% | 12% | 7% |
(Source: Pew Research Center, “Americans and AI 2026,” June 17, 2026)
Adults in their 30s and 40s saw the steepest jump of any group, enough to put them roughly on par with adults under 30 by 2026, a shift Pew highlights in its own analysis.
Separately, Claneo’s 2025 research puts AI chatbot use for information search among 16-to-27-year-olds (Gen Z) in the US at nearly 35%, a slightly different but directionally consistent figure using a different age cutoff and a search-specific question (Source: Claneo’s State of Search 2025).
How Often Do People Use AI for Search?
Frequency data, again from Pew’s own survey: 24% of all US adults use AI chatbots daily, rising to 31% among 18-to-29-year-olds and 34% among 30-to-49-year-olds. That drops to 19% for 50-to-64-year-olds and 7% for adults 65 and older (Pew Research Center, June 2026).
📌 Also Read: AI Chatbot Statistics 2026: Market Share, Adoption, and ROI
Why People Are Switching From Traditional Search to AI Search
Most Common Reasons People Use AI Search
Pew asked US adults directly why they use chatbots. Among adults 18 to 49, the top reasons were searching for information (53 to 54%), work tasks among employed adults (41 to 43%), creating or editing images and videos (34%), and general entertainment (33 to 36%). Getting diet and fitness information and getting medical advice each drew roughly a quarter of that age group (Source: Pew Research Center, June 2026).
What People Search for With AI Chatbots
The same Pew data shows information search is consistently the single largest use case across every age group, ahead of entertainment, work tasks, and emotional support. Roughly one in five adults under 30 said they’ve used a chatbot specifically for emotional support or advice, a smaller but notable use case that drops off sharply with age (Source: Pew Research Center, June 2026).
AI Search vs Traditional Google Search Behavior
The clearest documented behavioral difference so far is what happens after the answer appears. Pew Research found that when a Google AI summary appears, only 8% of users click through to a traditional link below it, compared with roughly 15% when no AI summary is shown.
Around 26% of searches that include an AI summary end without any further action, compared to 16% for searches that do not use an AI summary. (Pew Research Center, July 2025).
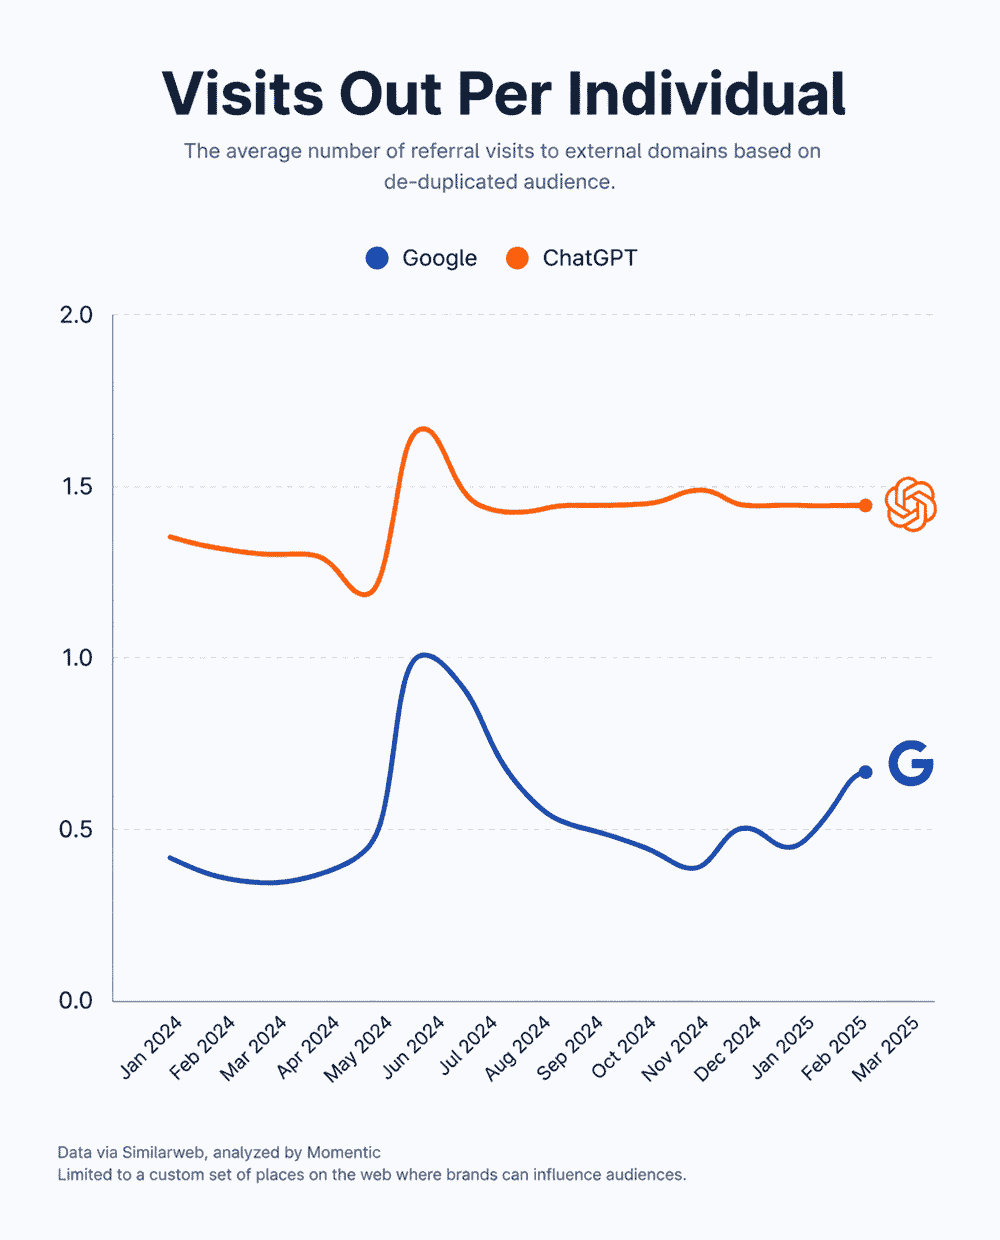
Standalone chatbot platforms behave differently from AI Overviews embedded in Google. Momentic’s 2025 analysis found ChatGPT users click an average of 1.4 external links per visit. This is more than double the 0.6 links per visit in a typical Google session (Source: Momentic’s 2025 Google vs. ChatGPT Analysis).
Trust behavior varies widely by platform. About 75% of consumers choose the top result in an AI-generated list, but if they see a brand they already trust anywhere on the list, they will switch to it, according to Growth Memo’s H1 2026 research.
In Google’s AI Mode, users accepted the AI’s product recommendation as-is 88% of the time. In contrast, with AI Overviews, users are more likely to click through, compare, and verify, similar to how they use traditional search. This difference matters: AI Mode seems to build more trust and makes the process easier, while AI Overviews are still mainly used for research (Search Engine Land, “AI halftime report: H1 2026,” July 29, 2026).
Google AI Overviews and AI Mode Statistics
How Often Does Google Show AI Overviews?
This is the most contested number in the entire topic, and reporting a single figure without context would misrepresent the data. Here’s how the major trackers compare for roughly the same window:
| Tracker | Reported trigger rate | Sample | Date |
| Semrush | 6.49% (Jan 2025), rising to a peak near 25%, then settling to 15.69% (Nov 2025) | 10M+ keywords | Jan to Nov 2025 |
| Conductor | 25.11% | 21.9 million queries | Q1 2026 |
| BrightEdge | 48% | 9-industry commercial tracker | March 2026 |
| Xponent21 | 60.32% | AdvancedWebRanking-derived US panel | April 2026 |
| Google (official) | “Roughly 50%” | Company disclosure | February 2026 |
The divergence isn’t a contradiction; it’s a methodology difference. Semrush’s panel skews toward mixed-intent keyword-research-style queries. BrightEdge tracks commercial verticals with longer, more informational query sets. Google’s own figure reflects its full query mix across all intents and geographies. Any single-number claim you see for “the” AI Overview trigger rate is compressing a genuinely wide, tracker-dependent range into a false precision.
Google AI Overview Trigger Rates by Query Type
This is where Semrush’s own first-party research (10 million+ keywords, October 2024 to March 2025) gives a clean, primary-sourced answer: informational queries account for 88% of all AI Overview-triggering searches, commercial queries for 8.69%, transactional queries for 1.76%, and navigational queries for just 1.43% (Semrush, “AI Overviews Study,” 2025).
That same research found 95% of keywords triggering AI Overviews carry no ads or minimal commercial value, and nearly 69% of AI Overview-triggering terms get 100 or fewer monthly searches. Google’s AI Overviews are, for now, concentrated overwhelmingly on low-commercial-value, low-volume, informational search, not the high-intent purchase queries most businesses worry about most.
Google AI Overview Adoption and Usage Statistics
Google itself has disclosed that AI Overviews reach roughly 2 billion monthly users across more than 200 countries, a figure the company shared in its 2025 earnings materials and has referenced since (Google, via Semrush citation of Alphabet Q2 2025 earnings).
Google AI Mode Usage Statistics
AI Mode is Google’s more conversational, agentic search experience, distinct from the AI Overview snippets shown in classic search results. Since expanding globally in October 2025, AI Mode has surpassed 1 billion monthly active users, according to Alphabet’s own Q2 2026 earnings call.
Google says AI Mode is driving an incremental increase in total search queries, not simply cannibalizing existing ones, and that it now sends billions of clicks to websites every week through AI features in Search overall (Alphabet Q2 2026 earnings call, July 22, 2026).
Google called AI Mode’s rollout the biggest search box upgrade in 25 years at its Search I/O 2026 event. The company also confirmed that AI Mode has reached 1 billion monthly active users. Queries inside AI Mode run roughly three times longer than classic search queries. This shows people use it for more conversational, multi-part, complex questions rather than short keyword lookups. (Source: Google, Search I/O 2026)
Why AI Overview Trigger Rate Numbers Vary So Widely
Beyond the tracker-methodology differences covered above, the underlying trigger rate itself has genuinely moved over time, not just been measured differently.
Semrush’s own data shows a real recalibration: AI Overview prevalence rose from 6.49% in January 2025 to a peak near 25% in July 2025, then Google pulled back to 15.69% by November 2025 before commercial and navigational query coverage expanded again into 2026.
Anyone comparing two AI Overview statistics needs to check both the tracker and the month, not just the headline percentage.
AI Overviews vs Traditional Search Results
When an AI Overview appears, it visibly changes on-page user behavior. Users who see an AI summary click a traditional organic result about half as often as users who don’t (8% vs. roughly 15%), per Pew’s July 2025 research.
Being cited as a source inside an AI Overview does provide a measurable, if modest, benefit: Seer Interactive’s research across more than 7,800 queries found that cited sources see click-through rates rise from about 0.6% to roughly 1.08%, meaningfully better than ranking below the Overview uncited.
ChatGPT, Gemini, Perplexity, and Copilot Search Statistics
ChatGPT Search Statistics
OpenAI’s most recently confirmed official figure, reported by Reuters in February 2026, puts ChatGPT weekly active users at 900 million, up from 400 million a year earlier. The ChatGPT app crossed 1 billion monthly active users in June 2026, per Reuters reporting, making it the fastest app in history to reach that scale.
Some later reporting (The Information, late July 2026) suggests weekly actives may be nearing 1 billion too, but OpenAI has not officially confirmed that specific figure, so we’re presenting it as unconfirmed rather than settled.
Google Gemini Search Statistics
Gemini’s monthly active user count comes directly from Alphabet’s own SEC-filed Q2 2026 earnings release: 950 million monthly active users, with daily active users tripling over the prior year.
Gemini’s underlying models now process roughly 22 billion API tokens per minute, up from 16 billion the prior quarter (Alphabet Q2 2026 earnings release).
Perplexity Search Statistics
Reliable first-party usage figures for Perplexity are harder to establish than those for ChatGPT or Gemini because the company is privately held and publishes less detailed data.
One clearly documented audience estimate comes from Similarweb, which provides demographic data based on its own methodology rather than an official disclosure from Perplexity. As a result, treat figures like exact monthly active users or query volume as Perplexity estimates.
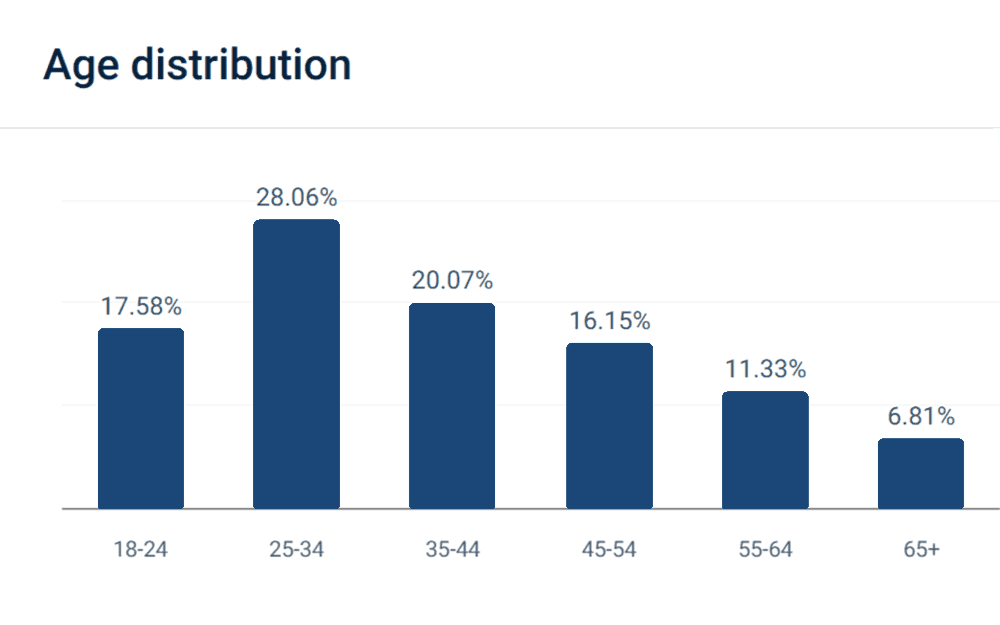
The available audience data points to a relatively young user base. Users aged 25 to 34 account for 28.06% of the audience, the largest age group, followed by 35 to 44 at 20.07% and 18 to 24 at 17.58%. Combined, users aged 18 to 44 represent 65.71% of Perplexity’s audience. Older age groups make up smaller shares: 16.15% aged 45 to 54, 11.33% aged 55 to 64, and 6.81% aged 65 or older. This distribution suggests Perplexity has strong reach among younger adults and working-age users.
Microsoft Copilot Search Statistics
Similarly limited. First Page Sage’s research estimated Microsoft Copilot at roughly 103 million users as of February 2026, an independent analyst estimate rather than a Microsoft disclosure. We’re including it because it names a specific methodology and date, but flagging that it carries less certainty than the Alphabet and OpenAI figures above.
AI Search Engine Market Share
Precise, apples-to-apples market share figures across AI search platforms are one of the weakest-sourced categories in this entire space. Different trackers define “AI search” differently (chatbot usage, referral traffic share, query volume), and estimates diverge sharply as a result.
We’re not presenting a single definitive market share breakdown. What’s well documented instead is relative scale: ChatGPT leads on weekly active users by a wide margin (900 million vs. Gemini’s smaller but fast-growing 950 million monthly, note the different unit), followed by Copilot and Meta AI, based on Pew’s own US adult chatbot-use survey: ChatGPT 44% of US adults, Gemini 24%, Copilot 17%, Meta AI 14%, Grok 8%, Claude 6%, Character.ai 3% (Pew Research Center, June 2026).
AI Search Market Share by Platform
One key metric is the share of AI search activity. ChatGPT’s share fell from 78% in July 2025 to 56% in July 2026. At the same time, Gemini’s share rose from 15% to 30%, and Claude’s went up from 2% to 10%, per Kevin Indig’s Growth Memo tracking, published in Search Engine Land’s H1 2026 halftime report (Search Engine Land, July 29, 2026).
This measures the share of AI search activity, a different metric than the “ever used” adoption percentages in Pew’s table above. The two should not be read as contradicting each other. Together, they show the same trend from two angles: Google is closing the gap on ChatGPT fast.
Which AI Search Engine Is Growing the Fastest?
By absolute user growth, Gemini and AI Mode combined show the steepest recent trajectory: Gemini nearly 50% growth in nine months, AI Mode crossing 1 billion MAU from a standing start in October 2025. By relative growth, ChatGPT’s climb from 400 million to 900 million weekly actives in a year is also a clean doubling. Given the different bases each platform started from, “fastest growing” depends heavily on which metric you weight, and we’d caution against any single ranking that claims otherwise.
How AI Search Is Changing Organic Click-Through Rates
How AI Overviews Affect Google CTR
Seer Interactive’s longitudinal study, tracking 53 brands and 5.47 million queries over 14 months, found organic CTR on AI Overview queries collapsed from 1.76% to a floor between roughly 0.61% and 1.3% (different 2026 write-ups of the same underlying Seer data cite slightly different floor values) between June 2024 and roughly December 2025.
It then rebounded to approximately 2.4% by February 2026, an increase of roughly 85% in two months that runs counter to a purely one-directional “AI is destroying clicks” narrative.
Organic CTR With and Without AI Overviews
Pew’s July 2025 research, cited above, remains the cleanest single comparison: 8% traditional-link click-through when an AI summary is present, versus roughly 15% when it isn’t.
Zero Click Searches and AI Search
Bain & Company’s research found that roughly 60% of searches on traditional search engines now yield no click at all. Plus, about 80% of consumers now use AI-generated results for at least 40% of their searches (Source: Bain & Company’s Consumer Reliance on AI Report 2025).
Semrush’s own tracking found that zero-click rates for AI-Overview-triggering keywords actually declined slightly across 2025 (from about 33.75% to 31.53%), a nuance that complicates the simple “AI Overviews cause zero-click search” claim.
How AI Answers Affect Website Traffic
Press Gazette reported that Google search referral traffic to publishers declined globally by roughly a third through November 2025, one of the more concrete publisher-side traffic figures available, though it aggregates across many sites and doesn’t isolate AI Overviews as the sole cause.
Recent data gives a clearer view of the situation. Press Gazette reports that by mid-2026, referral traffic has dropped by about 33% year over year. SparkToro’s 2026 analysis shows that 68% of Google searches now end without any clicks, which is up from the roughly 60% zero-click rate mentioned earlier in this report.
Kevin Indig had predicted that up to 70% of 2024 organic traffic might disappear by 2026, but he later acknowledged that the real decline was closer to a third. This shows that even well-informed forecasts in this field can sometimes outpace the actual data.
Which Search Queries Lose the Most Clicks?
Based on the query-type trigger data above, informational queries are most likely to show an AI Overview and, by extension, most exposed to CTR compression, since AI Overviews are heavily concentrated there rather than on commercial or transactional searches.
AI Search Referral Traffic Statistics
How Much Traffic Do AI Search Engines Send to Websites?
Search Engine Land’s 2025 Previsible AI Traffic Report, tracking 19 GA4 properties, found LLM-referred sessions rose from roughly 17,000 to 107,000 when comparing January to May 2024 against the same period in 2025, a real but still small absolute share of total traffic for most sites (some report over 1% of sessions from AI platforms combined) (Search Engine Land, 2025, cited via Semrush).
ChatGPT Referral Traffic Statistics
Semrush’s own AI Search SEO Traffic Study found that half of all links ChatGPT cites point to business and service websites, followed by news and media sites (9.5%), blogs and content sites (8.3%), and ecommerce sites (7.6%). ChatGPT users click an average of 1.4 external links per visit, more than double the 0.6 average for a Google session.
Perplexity Referral Traffic Statistics
Most visitors to perplexity.ai arrive directly, accounting for 86.51% of traffic. Google.com is the next biggest source at 6.84%. Smaller sources include accounts.google.com (0.65%), ChatGPT.com (0.35%), and YouTube.com (0.28%). After leaving perplexity.ai, users most often visit google.com (5.91%) and youtube.com (2.86%), with others going to nih.gov (1.73%), ppl-ai-file-upload.s3.amazonaws.com (1.32%), and ChatGPT.com (1.07%).
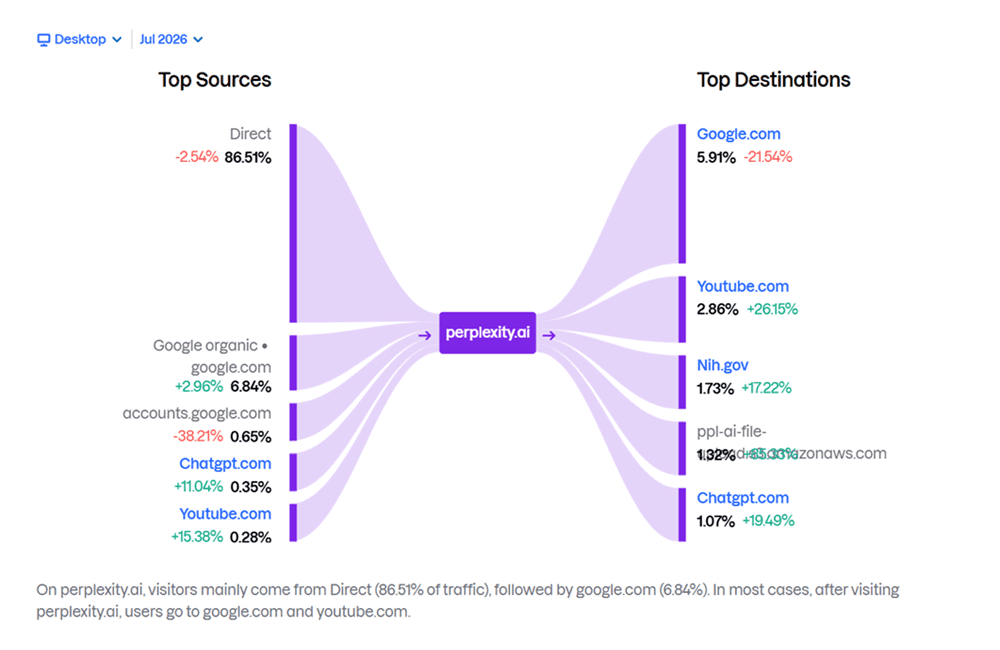
It indicates Perplexity users often switch between AI search, regular search engines, video sites, and trusted sources. For businesses and publishers, this means it is important to be visible across several channels instead of relying on just one.
Our research found little independently verified, platform-specific referral traffic dataset for Perplexity with a named methodology and sample size. So we are not including fabricated figures.
Gemini Referral Traffic Statistics
Here we have the same limitation. Google references Gemini and AI Mode referral-click volume only in aggregate (“billions of clicks… every week through AI features in Search”), without a platform-specific breakdown we could independently verify.
AI Referral Traffic Growth in 2026
The clearest documented year-over-year trend remains the Search Engine Land figure above, a roughly 6x increase in LLM-referred sessions across its tracked panel from 2024 to 2025.
AI Search vs Google Referral Traffic
Where the data does exist, AI-referred visitors look meaningfully different in behavior and value from typical organic traffic. Semrush’s traffic-value modeling puts the average AI search visitor at roughly 4.4 times the value of a traditional organic search visitor. For retail specifically, Adobe’s 2025 analysis found AI-referred visits had a 27% lower bounce rate, 38% longer sessions, and 10% more pages viewed per visit than non-AI traffic (Source: Adobe, 2025).
AI Search Adoption by Industry and Query Type
Coverage varies widely by vertical, and much of what circulates for individual industries beyond the two below traces to secondary blog aggregation rather than a named primary study. We’re including what has a traceable source and skipping detailed breakdowns for verticals (finance, travel, local search) where we couldn’t confirm one.
AI Search Statistics for Ecommerce
Adobe’s retail-specific referral data above is the strongest ecommerce-specific figure available. Separately, Liquid Web’s research found nearly half of online sellers (47%) already use AI to generate product content, a related but distinct adoption metric.
AI Search Statistics for B2B and SaaS
BrightEdge’s industry tracking, cited across multiple 2026 secondary sources, places B2B Technology among the higher-coverage verticals for AI Overview presence, alongside healthcare and education, though we could not independently verify BrightEdge’s underlying methodology beyond its citation in secondary reporting, so this is labeled as secondary-sourced.
AI Search Statistics for Finance, Healthcare, Travel, and Local Search
We could not locate primary, independently verifiable data specific to these four verticals with a named sample size and methodology. Secondary sources cite figures like “88% for healthcare” and “37% for entertainment” attributed to BrightEdge’s industry tracker, but because we could not access BrightEdge’s underlying report directly, we present these only as secondary-sourced estimates rather than confirmed statistics, consistent with this report’s sourcing policy.
AI Search Adoption by Query Intent
Covered in depth above under Google AI Overview trigger rates by query type: informational queries dominate at 88%, with commercial, transactional, and navigational queries all in the low single digits by comparison (Source: Semrush, 2025).
Informational vs Commercial AI Search Queries
Also covered above. Worth restating the practical implication: 95% of AI-Overview-triggering keywords carry no ads or minimal commercial value, which means Google is, for now, concentrating this experience away from its own highest-revenue search queries.
What Types of Queries Trigger AI Search Results?
Informational, Commercial, Transactional, and Navigational Queries
Semrush’s primary research breaks this out cleanly: informational queries make up 88% of AI-Overview-triggering searches, commercial queries 8.69%, transactional queries 1.76%, and navigational queries 1.43% (Source: Semrush, 2025).
Long Tail and High Intent Queries
Nearly 69% of AI-Overview-triggering terms receive 100 or fewer monthly searches, and roughly 80% fall into a low keyword-difficulty range, per the same Semrush study. AI Overviews concentrate heavily on long-tail, low-competition informational content rather than fiercely contested head terms.
How AI Search Is Changing SEO and Content Marketing
AI Search and Brand Visibility, AI Citations, and Website Mentions
Semrush’s citation-category data, cited above, is the clearest evidence of what gets cited: business and service websites make up half of all ChatGPT citations, well ahead of news sites, blogs, and ecommerce pages. That suggests direct, authoritative company content, not just third-party coverage, has real potential to be cited by AI platforms.
An important measurement issue most AI visibility tools miss is that citation overlap between multiple engines is very small. In fact, 91% of citations show up in only one of ChatGPT, Perplexity, or Google AI Overviews, according to Growth Memo’s H1 2026 citation research.
A single blended “AI visibility score” across engines therefore can be misleading. If a brand is cited often in one engine but not at all in another, the average doesn’t tell the full story. Tracking citation and brand-mention rates for each engine, not as one combined number, is the more accurate approach.
What Makes a Website More Likely to Be Cited by AI?
Beyond the citation-category data above, we don’t have a rigorously verified, named-methodology ranking of specific on-page factors (structured data, content length, author credentials) that drive AI citation likelihood. Several tools and vendors publish citation-factor checklists, but most trace to internal, unpublished analysis rather than a citable independent study, so we’re not presenting a specific factor list as verified fact here.
AI Search Optimization vs Traditional SEO
The practical distinction the data supports: traditional SEO optimizes for ranking position on remaining organic queries, a shrinking share of total search volume for informational content specifically. AI search optimization (often called AEO or GEO) optimizes for citation within AI-generated answers, where the reward is a smaller but higher-value click, per the 4.4x traffic-value figure above, rather than ranking position itself.
AI Search Statistics for Publishers and Businesses
Impact of AI Search on Website Traffic and Publisher Traffic Loss
Press Gazette’s roughly one-third decline in global Google referral traffic to publishers, cited above, is the most concrete aggregate figure available for publisher-side impact through late 2025.
AI Search and Brand Discovery, Conversion, and Purchase Behavior
The 4.4x AI-visitor-value figure and Adobe’s retail engagement data (lower bounce rate, longer sessions) are the strongest documented conversion-behavior signals currently available. We don’t have verified, named-source data on AI-driven purchase behavior broken out by product category beyond the retail-wide Adobe figures already cited.
How Businesses Are Responding to AI Search
Semrush’s own survey work found close to 70% of businesses report higher ROI after integrating AI into their SEO and content workflows, a self-reported figure worth reading as directional rather than independently audited.
AI Search Trends to Watch in 2026
The Rise of AI Agents and Agentic Search
Google’s own Q2 2026 earnings call is the strongest primary evidence here: Alphabet executives describe AI Mode explicitly moving toward agentic capabilities, with new features like a personalized agent product rolling out in the US, and the company frames the shift as moving from “does my page rank” toward “does the agent choose, trust, and transact with my brand.”
The Shift From Keywords to Conversational Queries
The query-type data above already shows this in motion: navigational and commercial query coverage in AI Overviews grew substantially through 2025 even as informational queries remained dominant, a sign that Google is extending the conversational, AI-mediated experience beyond its original informational-only starting point.
Multimodal AI Search and Personalized Results
Both trends are real and referenced directly by Google in its own earnings commentary (Gemini’s image and video capabilities, personalized agent features), but we don’t have independently verified adoption or usage statistics specific to multimodal AI search queries as a category, so we’re describing the trend qualitatively rather than attaching an unverified number to it.
The Future of Google Search in the AI Era
Given that Search and Other revenue grew 17% year over year to $63.3 billion in Q2 2026 even as AI Mode crossed 1 billion users, the near-term data does not support a “Google Search is dying” narrative. It supports a genuine restructuring of how that revenue and usage gets generated.
AI Agents and Non-Human Traffic
Search behavior isn’t the only thing changing. HUMAN Security’s analysis of over one quadrillion digital interactions found that automated (non-human) traffic is growing eight times faster than human traffic year over year. AI-driven traffic, meaning traffic generated by or on behalf of AI systems rather than by a person clicking, grew 187% from January to December 2025, nearly tripling over the year. This activity is concentrated in retail and ecommerce, streaming and media, and travel and hospitality (Source: HUMAN Security, “2026 State of AI Traffic & Cyberthreat Benchmark Report,” March 2026).
The report frames 2025 as the year AI systems shifted from merely reading the web to transacting on it directly, placing orders and completing checkouts on a user’s behalf. That shift carries a security dimension worth noting for any site owner. HUMAN also recorded post-login account compromise attempts more than quadrupling year over year, and scraping-attack traffic nearly doubling as a share of total traffic since 2022, approaching 20%. This is infrastructure-level data, distinct from the search-behavior statistics elsewhere in this report, but directly relevant for anyone building AI-agent access into a site or storefront.
Legal and Regulatory Pressure on AI Search
Publishers have started taking the traffic decline to court and to regulators rather than just absorbing it. A Munich court held Google liable for false statements generated by AI Overviews in June 2026. That same month, roughly 400 newspapers sued OpenAI and Microsoft over unauthorized use of their content.
The UK’s Competition and Markets Authority ordered Google to give publishers greater control and transparency over how their content is used in AI search, including the ability to opt individual sites out of AI Overviews, AI Mode, and Discover summaries specifically. (Source: CMA Press Release)
Google’s response so far has been an impression-based AI reporting feature added to Search Console, giving site owners visibility into how often their content appears in AI-generated results. Whether that becomes a genuine negotiating lever for publishers or a data point in an ongoing legal fight is still an open question heading into the second half of 2026.
AI Search Statistics by Year
2024 to 2026 Growth Snapshot
| Metric | 2024 Stats | 2026 Stats |
| US adults who have ever used AI chatbots (Pew) | 33% | 49% |
| ChatGPT weekly active users | ~400 million (early 2025 baseline) | 900 million (Feb 2026) |
| AI Overview trigger rate (Semrush panel) | 6.49% (Jan 2025) | 15.69% to 25%+ depending on month and tracker |
| Gemini monthly active users | ~650 million (Oct 2025) | 950 million (Q2 2026) |
(Sources: Pew Research Center (June 2026), OpenAI via Reuters, Semrush (2025 to 2026), Alphabet Q2 2026 SEC filing.)
What These AI Search Statistics Mean for SEO
Should Businesses Still Focus on Google SEO?
Yes, definitely. Google Search revenue is still growing, and 82% of AI-Overview-triggering queries remain informational, low-commercial-value searches, meaning most high-intent commercial and transactional queries still resolve through traditional organic and paid results, per Semrush’s own trigger-rate-by-intent data above.
Should You Optimize Content for ChatGPT and Gemini?
Yes, particularly for informational and research-style content, given ChatGPT’s citation patterns favor direct business and service content, and AI-referred visitors show measurably higher engagement value once they do click through.
The Most Important AI SEO Metrics to Track
Based on the data in this report, three metrics matter most right now: AI Overview and citation visibility for your target queries, the split between AI-referred and organic-referred traffic value (since AI visitors convert and engage differently), and organic CTR trends specifically on queries where AI Overviews appear, since that floor has already shown one real rebound in early 2026.
Frequently Asked Questions
Q: How many people use AI search in 2026?
A: 49% of US adults report using AI chatbots as of Pew’s February 2026 survey, up from 33% in 2024. Platform-level usage is larger in absolute terms: ChatGPT has 900 million weekly active users, and Google’s Gemini and AI Mode combined reach well over a billion monthly users.
Q: What percentage of Google searches show AI Overviews?
A: It depends entirely on which tracker you ask. Estimates for early-to-mid 2026 range from roughly 25% (Conductor) to 48% (BrightEdge) to over 60% (Xponent21), with Google’s own disclosure at “roughly 50%.” The variation comes from different keyword panels and methodologies, not disagreement about whether the feature is growing.
Q: What is the most popular AI search engine?
A: By reported US adult usage, ChatGPT leads clearly at 44%, followed by Gemini at 24%, Copilot at 17%, and Meta AI at 14%, per Pew Research Center’s June 2026 survey.
Q: Is AI search replacing Google?
A: Not based on current revenue data. Google’s Search and Other revenue grew 17% year over year in Q2 2026 even as AI Mode crossed 1 billion monthly users, suggesting AI features are additive to Google’s search business so far, not simply cannibalizing it.
Q: Does AI search reduce organic traffic?
A: When AI Overviews appear in informational searches, they measurably reduce the amount of organic traffic those queries receive. Click-through rates dropped from 1.76% to about 0.6%, but then rebounded again to around 2.4% by February 2026. Commercial and transactional queries are less affected because AI Overviews rarely show up for them directly.
Q: How does AI search affect SEO?
A: It adds a citation-visibility layer on top of traditional ranking. Being cited as a source inside an AI Overview modestly improves click-through rate, and being cited by name in a chatbot answer can drive referral traffic that converts and engages at a notably higher rate than average organic traffic.
Q: What is AI search optimization?
A: Often called AEO (answer engine optimization) or GEO (generative engine optimization), it’s the practice of structuring content so AI systems are more likely to cite it directly in a generated answer, as distinct from traditional SEO’s focus on ranking position in a list of links.
Research Methodology and Data Sources
Every statistic in this report is attributed to a named source with a stated date and, where available, a sample size. Primary sources used include Pew Research Center’s “Americans and AI 2026” study (5,119 US adults, surveyed February 17 to 23, 2026), Alphabet’s Q2 2026 earnings release filed with the SEC, OpenAI’s official disclosures as reported by Reuters, and Semrush’s own first-party AI Overviews research.
Where a widely repeated statistic could not be traced to a verifiable primary source, or where we could not confirm a secondary source’s underlying methodology, we labeled it as unverified or secondary rather than presenting it as settled fact.
This is most notable in the market-share, per-platform referral traffic, and several industry-vertical sections, where the available public data is currently thinner than the volume of secondary coverage might suggest. This report will be updated as fresher, better-sourced data becomes available in those areas.
📌 Also Read: AI Statistics 2026: Adoption, Investment, and Industry Trends
